| Metric Type | Description | Examples |
|---|---|---|
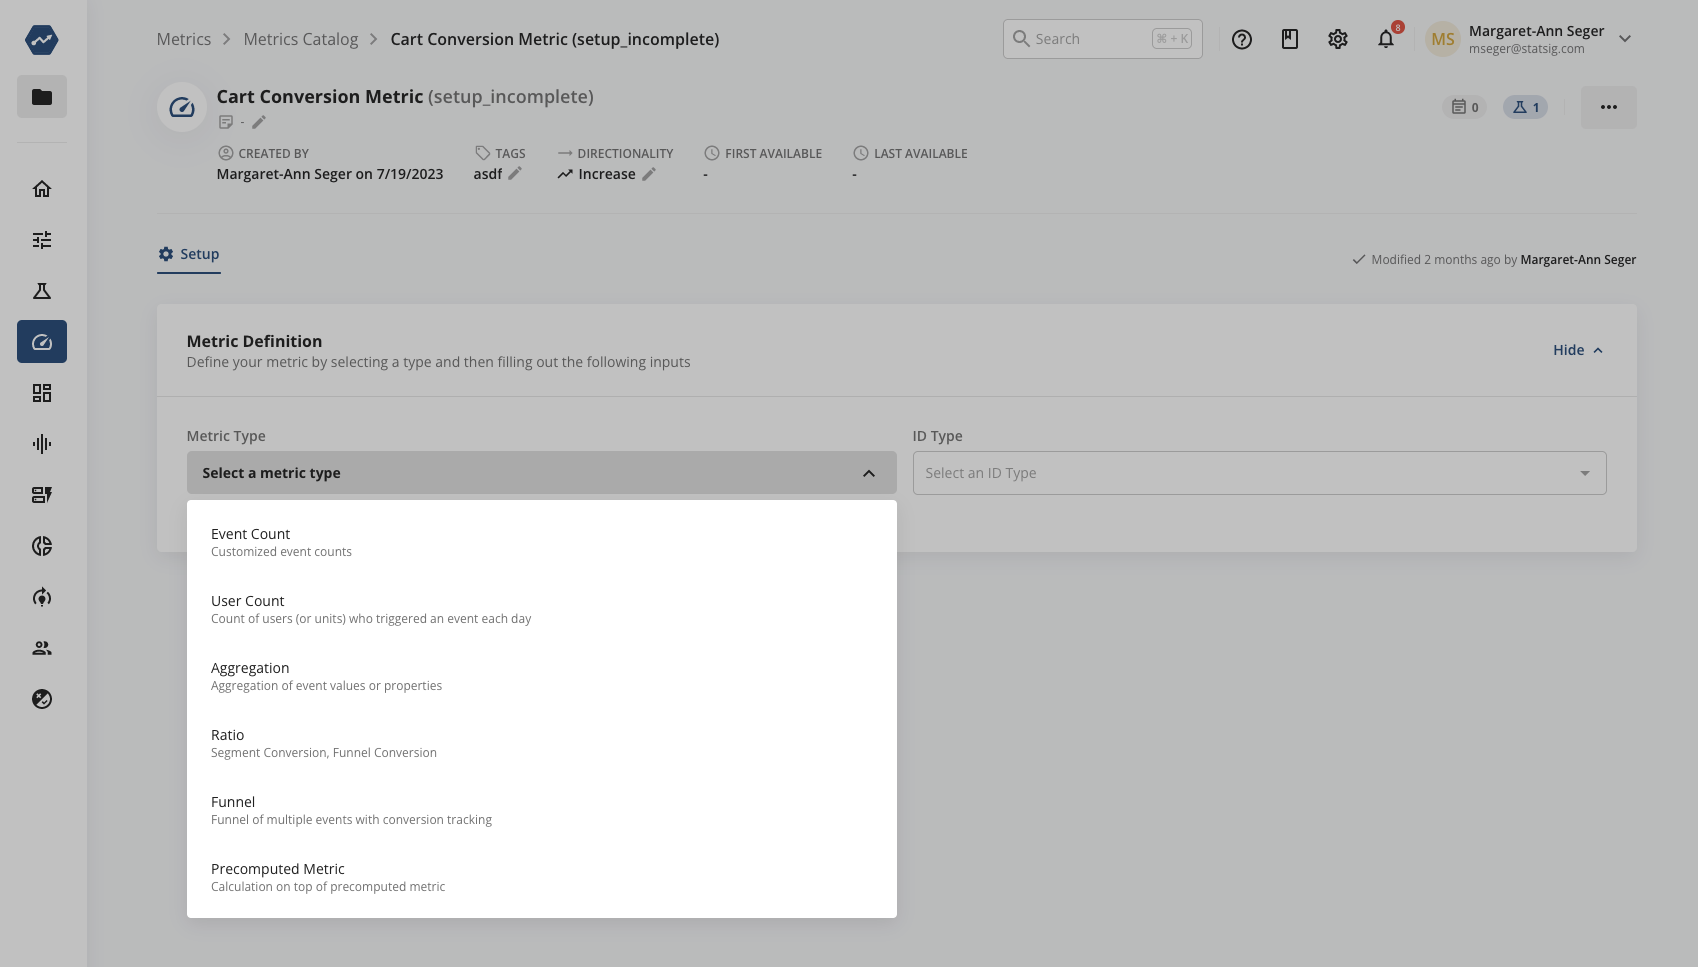
| Event Count | Total count of events filtered by the Value, Metadata, or User Object properties of an event type | Add to Cart event filtered by category type |
| User Count | Number of unique users that trigger events filtered by the Value, Metadata, or User Object of an event type | Active Users based on their views of a product category |
| Aggregation | Sum or Average of the Value, Metadata, and User Object property of an event type | Total Revenue |
| Ratio | Rates (e.g. cart conversion rate, purchase rate), Normalized Values (e.g. sessions per user, items per cart) | Cart Conversion Rate, Sessions per User |
| Funnel | Funnels- funnel of multiple events with conversion tracking | Sign-up Funnel, Checkout Funnel |
| Count Distinct | Count Distinct- Number of unique values for a given field, often approximated with sketches | Unique Songs listened per user |
Examples
1. Event Count Metrics
Here’s an example of setting up a custom event metric to count the number of add_to_cart events filtered by a metadata property called value, which carries the price of the item added to the cart. As this example specifies the ID Type as userID, Statsig will compute this metric as part of the test group that the corresponding user is assigned to in an experiment.2. User Count Metrics
The example below creates a metric to count the number of unique users who viewed a product in the toys category that was priced under $10.- Daily Participation Rate: It counts the total number of days that a user has the selected event, divided by the number of days the user is in the experiment. The result is a metric value between 0 and 1, which represents the probably of a user having the event on a daily basis. It works best for events that are expected to occur repeatedly for a given user.
- One Time Event: This checks if a user has the selected event at least once during their time in the experiment. The result is a binary metric with value 0 or 1 for each user. This is ideal for events that are only expected once per user, such as sign up events.
- Custom Attribution Window: Allows you to define a custom window after exposure to count an event towards a metric calculation.
3. Aggregation Metrics
The example below shows a Total Revenue metric that sums the value associated with all purchase events._{"currency_code": "USD", "currency_value": 123.45}_
Statsig supports currency sums upon request. Please ask in Slack.
4. Ratio Metrics
The example below shows the creation of a Cart Conversion Rate metric. Here we use the unique users who triggered the purchase event as the numerator and the unique users who triggered the add to cart event in the denominator. Note that when calculating the numerator, we filter to only include users who also had the denominator event in the same day. So in the case of this metric, a user who only has purchase event on a given day without an add to cart on that same day will not count towards the numerator.A Word of Caution: In experimentation, ratio metrics are a frequent source of misleading information. It’s possible to see an increase in click through rate alongside a net decrease in total clicks (the opposite may also happen). This situation can occur if the number of unique users viewing a button (denominator) decreases. As a best practice, Statsig recommends tracking the numerator and denominator as independent metrics when monitoring ratio indicator. Ratio metrics are often subject to statistical noise and can be tricky to use for obtaining a statistically significant result. In addition, for the numerator in ratios, we exclude units which don’t have a denominator value.
5. Funnel Metrics
You can create a custom funnel metric, from either the Custom Metrics Creation wizard in the Metrics Catalog or via the Charts tab.Important Note: Statsig handles funnel metrics differently between our Cloud and Warehouse Native platforms. Funnel metrics using our Cloud platform are always unordered, meaning that funnel steps can be completed in any order, and they have a time window of one day. This means that for the metric to record a completion, all steps must be triggered by a user within 24 hours. In contrast, funnel metrics on Warehouse Native have the option to be set with strict ordering and custom time windows.
Components of Funnel Metrics
Funnel metrics have a few components:- Lineage: Surfaces the events used to generate the funnel
- Metric Value: Metric value represents the overall funnel conversion rate, or the percentage of users who complete a funnel (trigger the end event) relative to all users who start the funnel (trigger the starting event)
- Conversion rate between stages: This set of metrics track the percentage of users who triggered an event N relative to all users that triggered event N-1 in the funnel

- Both the Square and Circle variants show a lift in top-of-funnel DAU (Land Page View Start DAU). However, only the Square variant shows statistically significant increase in end-of-funnel DAU (Purchase Event End DAU).
- The overall funnel conversion rate improvement for Square is primarily due to the higher conversion from Checkout Event to Purchase Event stages in the funnel.

6 Count Distinct Metrics
- What it is: A high-performance way to estimate the number of distinct values using compact sketch data structures. Example use cases include trying to determine unique songs per user or unique products purchased by user.
- Benefit: Delivers much faster computation and uses significantly less memory compared to full exact distinct counting, especially at high cardinality.